Wouldn’t you love to know how people found your site? See how long visitors are staying after they came from Search, Facebook, or Remarketing ads? Or know how many visits it took before a user finally converted?
Google Analytics is the free tool to do just that. It doesn’t just track your business’s online sales and conversions, it gives insight into how people find and use your site. So it’s the perfect tool for a business or personal site. However, it can be a bit overwhelming for new users or even more experienced users.
Google Analytics packs a lot of data. At first glance, it takes some messing around with to discover which data is pertinent to helping you understand your site visitors better. In my blog today, I’m going to answer some questions like; What data do I need to be observing? Where is that data located? How do I apply this data to make changes to my current campaigns?
I’ll answer these questions by showing you:
- Who’s visiting your website?
- What are visitors doing once they get to your website?
- When are visitors coming to your site?
I’ve only scraped the surface with the blog post today, but I have noted throughout this article the topics that will be discussed further in future posts.
Set-Up
First, we need to make sure you have implemented Google Analytics Tracking on your website. You can sign up for an account at analytics.google.com. To set up an account, you’ll want to go under the primary Google Account that you already use (Gmail, Google Drive, Google Calendar, Google+ or YouTube) otherwise you can set up a new Google Account.
Once your account is set up, follow these steps to find the tracking code that will need to be placed on your site:
- Go to the Admin tab in the top toolbar.
- Under the middle column labeled ‘Property’ choose ‘Tracking Info.’
- Within the ‘Tracking Info’ drop-down window there will be an option named ‘Tracking Code.’
- Within the Tracking Code page, you’ll find the tracking pixel under the ‘Website Tracking’ option.
- This Universal Analytics tracking code will need to be copied and pasted into every web page you would like to track within your new Analytics account.
General Tips
- The top toolbar will include:
- Home: This screen contains all Websites Accounts you have access to.
- Reporting: This is where your site data lives.
- Customization: This screen is where you can build custom reports. (Future Post)
- Admin: This screen includes the Account, Property, and View information.

- You’re able to change the date within the right-hand corner and can even compare different times.

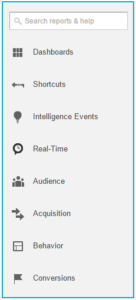
- Along the left-hand side toolbar there is:
- Dashboards: Th
 ere is where you will store you custom data boards.
 - Shortcuts: Another custom setting for frequently review reports.
- Intelligence Events: Snapshot of trends in traffic site.
- Real-Time: This screen shows you live data for your site.
- Audience: Understanding who your visitors are.
- Acquisition: Attributing where the site traffic is coming from.
- Behavior: Finding out what actions your visitors took while on site.
- Conversions: Tracking visitor actions.
- Dashboards: Th
Space
Space
Space
Space
Who is visiting your website?
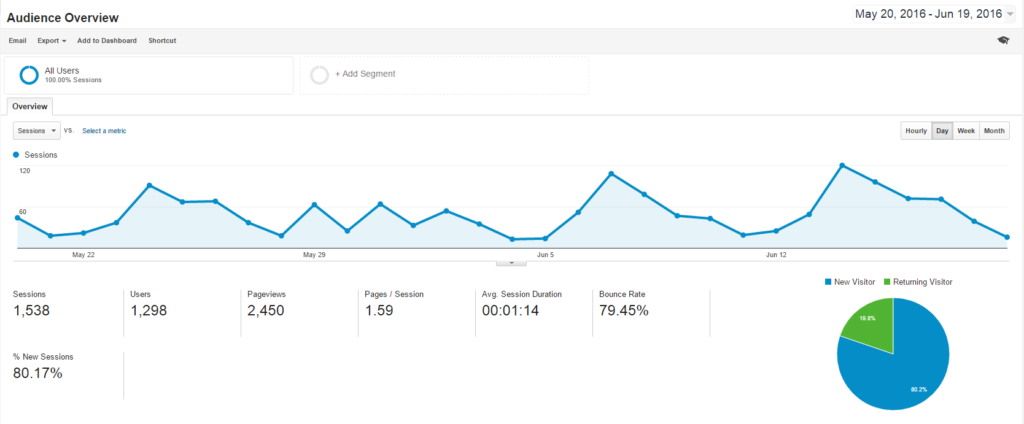
When you first log into an Analytics account, you’ll be taken to your Audience Overview report. This report gives you a high-level overview of the amount of visitors that have visited the site, how many sessions they performed, the amount of pages they viewed, average time on site, and bounce rate (percentage of people who left after visiting one page).
Under the Audience tab on the left-hand side, you can find a lot more information about the visitors on your site. With this information, you can better optimize your digital marketing.

Action Items:
- Within the Demographics section under Audience, you can get the age groups and gender of users on the site. If you notice a large portion of your visitors are 25-34, you can increase your bidding for this age group within your campaigns.
- Under the Mobile section, you may notice that there’s more traffic coming from mobile than desktop. This information can help you focus on improving the website experience on mobile devices by making your site more mobile friendly.
- Within the Interests section, you can review different categories that your visitors fall into. These various categories can provide great insight into additional targeting you can utilizes within your digital campaigns. For example, one of our higher percentage categories is technophiles, which makes sense since we are a Digital Advertising Agency. But in the In-Market Segment, we can see that a good amount of our visitors fall into the category Financial Services and in our Other Categories, we can then find out that nearly a quarter of our visitors are also interested in Arts and Entertainment.
What are visitors doing once they get to your website?
Another great opportunity within Analytics is being able to review on-site visitor behavior. One place you can find a lot of this information is under the Behavior section on the left-hand side. Here’s where you can review which pages visitors are looking at the most, which page is causing the users to leave most often, and how many pages on average users are viewing.

- Overview: High-level view of traffic on site and page rankings.
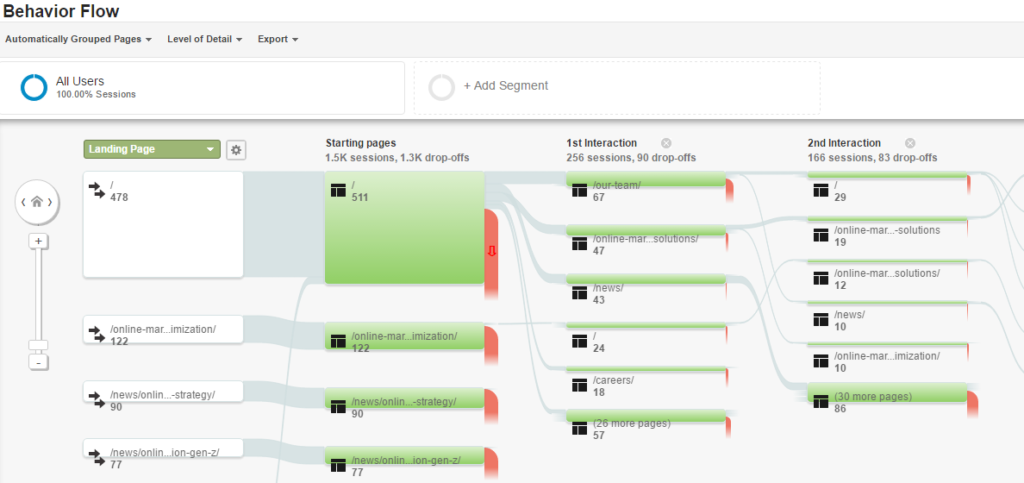
- Behavior Flow: Flow chart show how the majority of traffic navigates the site.
- Site Content: This section will break down traffic by all page visits, content categories, landing pages, and exit pages.
- Site Speed: How quickly your site loads broken down by browser, country, and page.
- Site Search: How users navigate your site broken down by on-site search queries. (Future Post)
- Events: Custom event tracking data. (Future Post)
- Publisher: In-depth data for AdSense and Ad Exchange.
- Experiments: Where you can test which version of a landing page results in the greatest improvement in conversions. (Future Post)
- In-Page Analytics: This gives a deeper dive into how users interact with your web page. (Future Post)
Action Items
- After reviewing the flow chart, which page on your site had the highest drop-off? Most pages will have some amount of drop off, but if any pages stand out, such as the check-out page or email newsletter sign-up page, then analyze these pages on your site. Maybe there’s an error with user experience or design that is confusing the visitors and driving them away.
- After reviewing site speed by page, are there any pages that seem to take an excessive amount of time to load? If so, analyze these pages on your site. If you notice there are large images or files within this page, it may be affecting the page load time.
From where and when are visitors coming to your site?
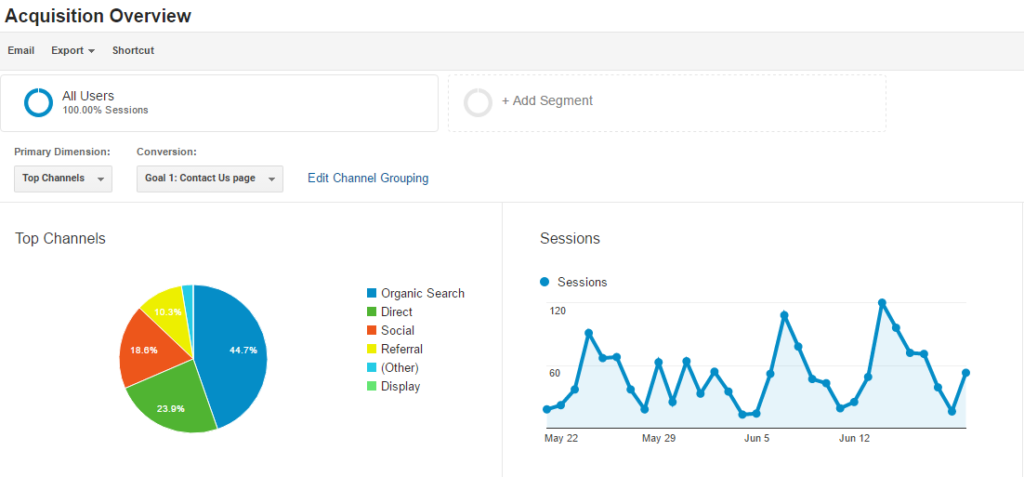
Under the Acquisition section in the left-hand side, you can find out information about where your visitors are coming from. This section is very important for reviewing traffic coming to site from your campaigns. You can also review which sources are sending the most traffic, which are sending the best traffic, and how long users are staying on your website.

- Overview: High-level view of Top Channels, Sessions, and Conversions.
- All Traffic: Traffic is broken out by Channels, Treemaps, Source and Mediums, and Referrals.
- Adwords: If you link your Adwords account to Analytics, this section will give you more in-depth data between the two accounts.
- Social: In-depth data of traffic coming from Social Network sites.
- Campaigns: In-depth data of traffic coming for Digital Campaigns.
Action Items
- After reviewing the Source and Medium section under All Traffic, you can see which sites are driving a high amount of quality traffic. If there is one site driving a good amount of organic traffic it might be smart to add in a layer of digital marketing on that site. Such as, if you notice a large quantity of traffic coming from Bing that has a high conversion rate, test out a Bing Search campaign to see if this helps boost performance.
- The Source and Medium section can also give insights into how current digital campaigns are performing. If you see a ton of clicks within your Facebook campaign but once in Analytics, you see Facebook traffic has a high bounce rate and low time on site then the targeting on the campaign or call-to-action with the ad copy might be off.
Closing
Remember, it’s not as useful just to report on the finding of Analytics, instead, analyze and use the data to improve your website and business. Once you understand how to fully utilize Analytics, it can be a powerful tool for many different reasons, not only for Digital Marketing campaigns.
In Part II of my review of Google Analytics, I’m going to cover:
- How users are interacting with your site content.
- How to set up Goals.
- How to Set up Site Search.
Hope to see you then.